Digitizing Data
These are all projects that required me to digitize data, either as a single step, or for the final product. As such, these may appear in other pages as well as in this one.
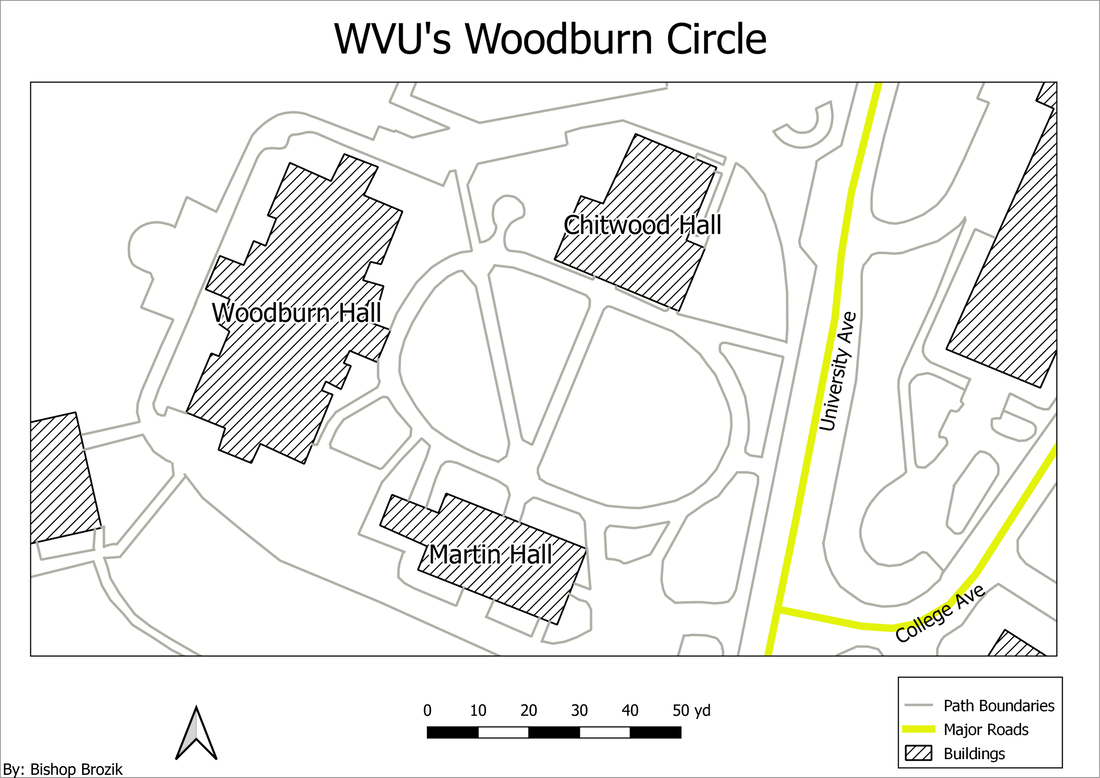
This is a digitized map of a portion of the WVU downtown campus. I created it using QGIS by digitizing the roads, buildings, and paths by referencing satellite imagery. I opted to make this as a way to learn the process of digitizing data and creating map layouts in QGIS, because up to this point I had only had experience in doing these processes in ArcGIS Pro.
WVU Downtown Campus Web App
This map is embedded in this webpage and can be interacted with. Each polygon can be clicked to bring up a table with information about the building it represents, layers can be toggled on and off and the user can select from a variety of base maps the widget in the bottom left hand corner can be used to quickly navigate between locations I felt to be most important. This is a web application that I created to assist some people who are prospective WVU students. The goal of this app is to help these new students navigate the WVU Downtown campus. The app is optimized to work on desktop as well as on mobile devices to allow students to view the buildings from home or on campus.
I created this using QGIS, ArcGIS Pro and ArcGIS Online. I created the data in QGIS by digitizing buildings on the downtown campus that I believed were relevant and populating the attribute tables with fields such as name, building abbreviation, address as well as an image of the building. I then brought the data over to ArcGIS Pro to symbolize and label the data so it wouldn't need further modification when I uploaded it to ArcGIS Online. From there, I used the Web App Builder to create an application that can be viewed on desktop as well as on mobile. I added widgets to allow the user to toggle data layers, search for locations and to use bookmarks that are linked to the college buildings. Above, I have embedded the application above, but it can also be found and shared with this link here.
During this process, I found that I much prefer using QGIS for digitizing data. I found it to be easier to create the data as well as to correct it if something was digitized incorrectly to begin with.
